
In This Issue
1. Top Futures Trading Chart Patterns
2. Live Daily Futures Trading Signals and Charts Service
3. Economic Calendar
A broadening top is a futures chart pattern that can occur on an upwards trend. It is generally classified as a reversal pattern but some traders argue that there is approximately a 50/50 split between whether it tends to move upwards or downwards upon completion of the pattern. For this reason, it can often be avoided by traders. It can be viewed as the opposite of a symmetrical triangle.
A broadening top is comprised of diverging support and resistance lines and resembles a megaphone. The rising resistance line and falling support line continue until the trend reverses. See the example below:
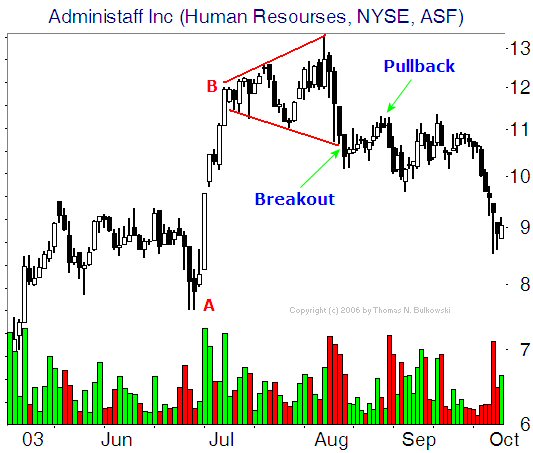
This is a less common futures chart pattern pointing to a highly unstable market. As support drops and resistance rises, volatility increases.
A broadening bottom is a chart pattern that can occur on an downward trend. It is generally classified as a reversal pattern but some traders argue that there is approximately a 50/50 split between whether it tends to move upwards or downwards upon completion of the pattern. For this reason, it can often be avoided by traders. It can be viewed as the opposite of a symmetrical triangle.
A broadening bottom is comprised of diverging support and resistance lines and resembles a megaphone. The rising resistance line and falling support line continue until the trend reverses. See the example below:
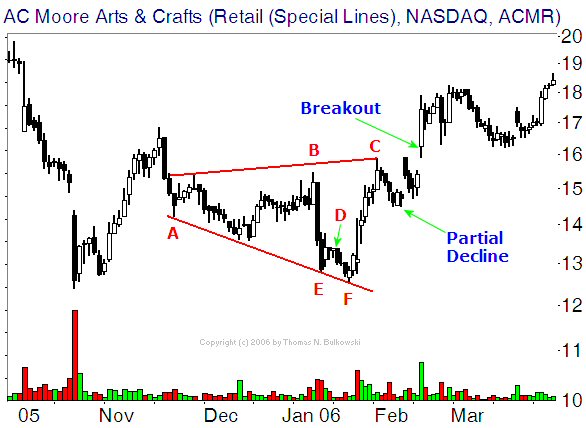
This is a less common futures chart pattern pointing to a highly unstable market. As support drops and resistance rises, volatility increases.
An cup and handle is a bullish continuation pattern which can mark a pause in an uptrend before it continues.
An cup and handle is formed as follows:
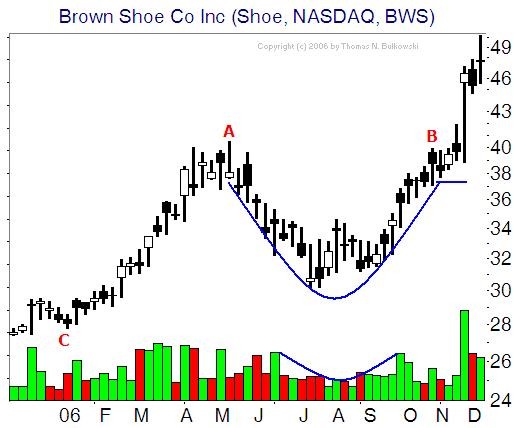
Resistance is tested in a unique way in this pattern, and it can be helpful to watch how the handle is formed. One possible rule of thumb is that the handle can comprise about one third of the movement of the cup portion of the pattern.
A descending triangle is a bearish pattern that can indicate an impending downward trend.
An descending triangle is formed when support remains flat as resistance drops. See the example below:
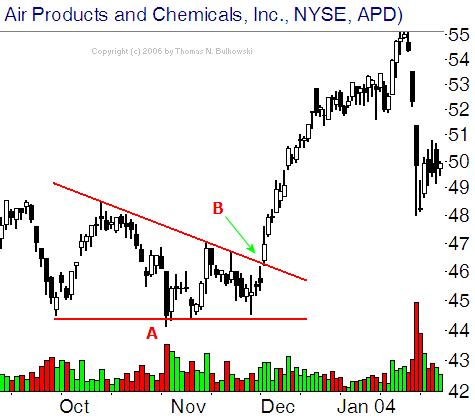
The price will rise and fall within the triangle until support and resistance converge. At that point, the apex, breakout occurs, usually downwards. Note that in the above example, the price moves upwards on completion of the pattern. This is not as common but it is important to be aware of all the potential movements when using chart patterns.

Disclaimer: trading Futures, Options on Futures, and retail off-exchange foreign currency transactions involves substantial risk of loss and is not suitable for all investors. You should carefully consider whether trading is suitable for you in light of your circumstances, knowledge, and financial resources. You may lose all or more of your initial investment. Opinions, market data, and recommendations are subject to change at any time.
Each trading day Ilan, Vice President of Cannon Trading Inc., holds a live educational futures trading signals and charts seminar.
During this live futures trading signals and charts service you will be able to:
- View Ilan's oil, gold and E-Mini S&P 500 futures charts, like the example futures chart below.
- Review his real-time futures trading signals and indicators.
Sign up to receive a daily invitation at the Cannon Trading Inc. website.

Click to enlarge the image.
Disclaimer: trading Futures, Options on Futures, and retail off-exchange foreign currency transactions involves substantial risk of loss and is not suitable for all investors. You should carefully consider whether trading is suitable for you in light of your circumstances, knowledge, and financial resources. You may lose all or more of your initial investment. Opinions, market data, and recommendations are subject to change at any time.
Source: Moore Research Center, Inc.
| Date | Reports | Expiration & Notice Dates |
| 03/16 Wed |
6:00 AM CDT - MBA Mortgage Purchase Index
7:30 AM CDT - Building Permits & Housing Starts(Feb) 7:30 AM CDT - Core PPI & PPI(Feb) 7:30 AM CDT - Current Account Balance(Q4) 9:30 AM CDT - API & DOE Energy Stats |
FN: Mar Lumber(CME)
LT: Apr Platinum Options(CMX) Apr Palladium Options(CMX) |
| 03/17 Thu |
7:30 AM CDT - Initial Claims-Weekly
7:30 AM CDT - USDA Weekly Export Sales 7:30 AM CDT - Core CPI & CPI(Feb) 8:15 AM CDT - Capacity Util & Industrial Prod(Feb) 9:30 AM CDT - EIA Gas Storage 9:00 AM CDT - Leading Indicators(Feb) 9:00 AM CDT - Philadelphia Fed(Mar) 3:30 PM CDT - Money Supply |
LT: Mar NASDAQ(CME)
Mar S&P 500(CME) Mar NASDAQ Options(CME) Mar S&P 500 Options(CME) Mar Value Line Options(CME) Apr Crude Lt Options(NYM) |
| 03/18 Fri |
7:30 AM CDT - Dairy Products Prices
2:00 PM CDT - Cattle On Feed 2:00 PM CDT - Milk Production |
LT: Mar DJIA(CME)
Mar E-Mini S&P 500(CME) Mar E-Mini NASDAQ(CME) Mar Russell(CME) Mar Value Line(CME) Mar DJIA Options(CME) Mar E-Mini S&P 500 Options(CME) Mar E-Mini NASDAQ Options(CME) Mar Russell Options(CME) Apr Orange Juice Options(ICE) |
| 03/21 Mon |
9:00 AM CDT - Existing Home Sales(Feb) | LT: Mar Coffee(ICE) |
| 03/22 Tue |
9:00 AM CDT - FHFA Housing Price Index(Jan)
2:00 PM CDT - Cold Storage |
LT: Mar 10 Year Notes(CBT)
Mar Bonds(CBT) Mar Butter(CME) Apr Crude Lt(NYM) |
| 03/23 Wed |
6:00 AM CDT - MBA Mortgage Purchase Index
9:00 AM CDT - New Home Sales(Feb) 9:30 AM CDT - API & DOE Energy Stats |
|
| 03/24 Thu |
7:00 AM CDT - Census Crush
7:00 AM CDT - Cotton Consumption 7:30 AM CDT - USDA Weekly Export Sales 7:30 AM CDT - Initial Claims-Weekly 7:30 AM CDT - Durable Orders(Feb) 9:30 AM CDT - EIA Gas Storage 3:30 PM CDT - Money Supply |
FN: Apr Crude Lt(NYM) |
| 03/25 Fri |
7:30 AM CDT - Dairy Products Prices
7:30 AM CDT - GDP-Third Estimate(Q4) 7:30 AM CDT - GDP Deflator-Third Estimate(Q4) 8:55 AM CDT - Michigan Sentiment-Final(Mar) 2:00 PM CDT - Quarterly Hogs & Pigs |
LT: Apr 2,5,10 Year Notes Options(CBT)
Apr Bonds Options(CBT) Apr Wheat Options(CBT) Apr Corn Options(CBT) Apr Oats Options(CBT) Apr Rough Rice Options(CBT) Apr Soybeans,Soyoil,Soymeal Options(CBT) |
| 03/28 Mon |
7:30 AM CDT - PCE Prices-Core(Feb)
7:30 AM CDT - Personal Income & Spending(Feb) 9:00 AM CDT - Pending Home Sales(Jan) |
LT: Mar Pork Bellies(CME)
Apr Copper Options(CMX) Apr Gold Options(CMX) Apr Silver Options(CMX) Apr Heating Oil Options(NYM) Apr RBOB Gasoline Options(NYM) Apr Natural Gas Options(NYM) |
| 03/29 Tue |
8:00 AM CDT - Case-Shiller 20-City Index(Jan)
9:00 AM CDT - Consumer Confidence(Mar) |
LT: Mar Copper(CMX)
Mar Gold(CMX) Mar Silver(CMX) Mar Platinum(CMX) Mar Palladium(CMX) Apr Natural Gas(NYM) |
* Please note that the information contained in this letter is intended for clients, prospective clients, and audiences who have a basic understanding, familiarity, and interest in the futures markets.
** The material contained in this letter is of opinion only and does not guarantee any profits. These are risky markets and only risk capital should be used. Past performances are not necessarily indicative of future results.
*** This is not a solicitation of any order to buy or sell, but a current market view provided by Cannon Trading Inc. Any statement of facts herein contained are derived from sources believed to be reliable, but are not guaranteed as to accuracy, nor they purport to be complete. No responsibility is assumed with respect to any such statement or with respect to any expression of opinion herein contained. Readers are urged to exercise their own judgment in trading!