
In This Issue
US Credit Market Seasonal Outlook
Reports and Expiration Notices
Cannon Trading is pleased to bring you a new exciting feature on our home page — live news search!
You can now view up-to-the-minute news alerts from trusted news sources around the world focusing on futures and commodities.
Looking for a specific topic? Just type your search term and press "go!"
As always with any new feature on our web site, we appreciate your feedback. Feel free to contact us with any questions or comments.

By Lara Akin, Man Financial
Executive
Summary: Third quarter growth will look surprisingly weak when it comes out at the end
of the month, but that quarter's weakness is behind us, and MGR expects to see
an improvement in the fourth quarter that continues to develop into the first
half of 2007. The pullback in energy prices will offset some of the weakness
caused by the pullback in the housing market. We believe energy will have a
greater impact on the consumer spending habits in the near term than housing.
The Fed will remain on hold into the end of the year, and possibly through the
first quarter of 2007, but we expect to see another rate hike before we see any
cuts.
The yield curve should steepen as the long end of the
curve struggles towards 5.50% which it will not hit until sometime in 2007. This
year we believe the note will be hard pressed to regain third quarter losses,
and retest 5.25% by the end of the year. The yield curve inversion will persist
as the Fed will end 2006 at 5.25% and the note will go out somewhere between 4.80%
and 5.00%. The greatest risks to our outlook remain the level of housing market
contagion and the risk that energy markets are unable to maintain their recent
declines.
10/10/06 Trade Recommendation:
Sell EDZ7 at 95.18. Primary Target 94.81, secondary
target 94.62, risk over 95.41.
Sell TYZ6 over 107-10. Primary Target 106-00, risk over 108-30
Third quarter growth will look surprisingly weak when it comes out at the end of the month, but that quarter's weakness is behind us, and MGR expects to see an improvement in the fourth quarter that continues to develop into the first half of 2007. The pullback in energy prices will offset some of the weakness caused by the pullback in the housing market. We believe energy will have a greater impact on the consumer spending habits in the near term than housing. The Fed will remain on hold into the end of the year, and possibly through the first quarter of 2007, but we expect to see another rate hike before we see any cuts.
The yield curve should steepen as the long end of the curve struggles towards 5.50% which it will not hit until sometime in 2007. This year we believe the note will be hard pressed to regain third quarter losses, and retest 5.25% by the end of the year. The yield curve inversion will persist as the Fed will end 2006 at 5.25% and the note will go out somewhere between 4.80% and 5.00%. The greatest risks to our outlook remain the level of housing market contagion and the risk that energy markets are unable to maintain their recent declines.
MGR retains our cautiously optimistic outlook for third and fourth quarter growth. Although we have not yet run the numbers, we would expect to see third quarter growth come in relatively slow 2.0-2.5%, with a significant risk to the downside. The three key risks to growth in the near term include:
Housing: Fed Chairman Ben Bernanke theorized the residential housing market could shave as much as 1% of GDP from the headline level.
Consumer resilience: stronger gas prices and slower auto sales during the third quarter suggests, at least for the near term that the consumer may finally be pulling back. We do not believe the September numbers will be able to offset the fact that there was only very modest growth in the first two months of the quarter.
Inventory Levels: Although the inventory numbers were revised lower in the final release of Q2 GDP, there is still an opportunity for a decline in inventory levels in the third quarter, which would pressure overall growth.
We see inventory as a double-edged sword, as moderation in the pace of inventory build may be a near term negative, but could set us up for improvement in the fourth quarter. Excess inventory is one of the main risks for recession. The chart below highlights the relationship between inventory and growth. Inventory levels tends to have a modest leading relationship with GDP, but there is definitely a ceiling to how high inventory build can go before growth slows as a result. With business inventories at 53.7Bn in the second quarter we are certainly near that ceiling, and would not be surprised to see inventory pull back in the third quarter. Just in time shipping has helped some of this volatility, and we expect any potential mismatch between inventory and sales to be short-lived.
Although these three factors are the main risks to growth, a wider trade balance supported by energy as well as import strength in general will also weigh on growth in Q3. Government spending, business structures, and services spending will all offer some upside support to third quarter growth.
We are more optimistic about the fourth quarter's outlook. The pullback in crude prices over the past six to eight weeks will take the pressure off both the manufacturing and consumer sectors as well as help drive the trade balance lower. We expect to see a strong holiday season further supported by the lower gasoline prices. This will keep the fourth quarter growth rates closer to a 3.0-3.5% level—at a level characterized more strong than middling. Lower energy prices will help narrow the trade deficit as well as offer support to consumer spending habits—essentially reversing much of the third quarter's weak spots.
We are firmly not in the position of looking for recession. MGR believes the housing market risk may lead to a slowdown, and perhaps a shift to a steady state, but will not lead to a recession. Recessions are caused by a mismatch between supply and demand, (too much inventory) and we believe the current slowdown was too widely expected to shift into a recession.
With the economy set to slow in the third quarter, MGR believes the Fed will remain on hold into the end of the year. We no longer expect to see the Fed increase rates at either their October or December meeting. We have adjusted our initial expectation for a 5.50 funds rate based on the Fed's shift in focus to include the housing market weakness. Into 2007 the Fed will not cut rates unless the housing market clearly leads to a pullback in personal consumption. This would not be evident until the end of the second quarter, and is therefore outside the scope of this report.
The Fed's recent statements have been a balancing act between an inflation focus and the growth risk posed by the housing slowdown. Although we believe the growth risk is overstated, (and the ongoing inflation threat still a problem) the FOMC seems content to follow market expectations for now. (For more information on the housing market and consumer risk see the consumer sector below, for now we will focus on inflation which is more closely aligned with the Fed's mission). That housing market slowdown should lead to a pause through the end of the year, but that is not the end of the story. Unless we see a dramatic shift in core inflation, (not just a single month's moderation due to outside influences) we would look for the next step from the Fed to be a rate hike.
There are many ways to look at the inflation threat, we could look at the last two month's core CPI index, and see back to back 0.2% price increases and decide the risk is past us, or we could look at the (welcome) reduction on OER from a persistent 0.4% monthly growth rate to a 0.3% growth rate last month, and again take a deep breath. Perhaps the most exciting reason to believe the inflation threat is weakening is to look at the pullback in energy prices: nationwide gasoline prices have fallen from an average $3.08 a gallon on Aug 7th to just $2.44 as of September 25th. This may be the most encouraging development in the inflation outlook, but risks remain. For one the median level of price increases as reported by the Cleveland Fed is still well above the weighted average reported by the BLS, and as seen in the chart below, and until last month the steep trajectory suggested ongoing increases in core inflation.
Another risk to inflation is presented in the chart below, which looks at the distribution of CPI components over the summer months less energy and Owners Equivalent Rent. The risk we see in this chart is that the annualized monthly percent change for most items is above the Fed's 2.0% comfort range, and the number of components who are increasing at a faster rate has actually increased over the summer. This shift is most clear in the 2-3% price block, but the 5% or greater range also presents a definite risk that we believe the Fed is aware of. The inflation risks support our expectation that the Fed has two options—hold steady or tighten.
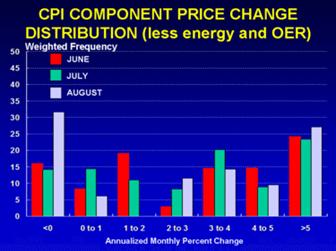
Source: David Altig, macroblog.typepad.com
Energy prices create a risk to the market outside of their traditional impact on inflation, or even on consumer spending. MGR believes energy prices are one of several (liquidity-based) reasons the yield curve is inverted and real yields are so low. We do not believe the markets are seriously trading either the inflation or the growth risk of high energy prices at the present time, but simply are looking for a way to distribute excess petrodollars.
During periods
of rapid acceleration in energy prices, the normal price/yield relationship
between the 10yr treasury and real crude prices tends to not carry through. One
way to look at this is to suggest the market stops trading the inflation risk
and starts trading the growth risk associated with higher energy prices.
Although it is certainly easy to argue the high yields and high energy prices
in the late 1970s were related, something seems to have happened in the
post-Volker years to fundamentally change that relationship. We will deal with
the 1970's later, but for now will start with the hypothesis that the
recirculation of petrodollars back into the
The chart above looks at the energy price/interest rate relationship on a month-end basis over time from 1983 to the present, where energy prices are seen in 2004 dollars. The purple diamonds are the energy shock associated with the first Gulf War, while the blue asterisks represent the current energy price shock, which started in roughly June 2002. When the markets are 'functioning normally' the relationship between energy and yields is generally strong and direct, but during times of rapidly accelerating energy prices, that relationship breaks down. If there were something fundamental about high energy prices leading to high inflation and by extension low bond prices, by now the market would have adjusted to the energy prices. That does not appear to have been the case.
MGR believes that this is due to a number of factors, but the most interesting is the recirculation of energy prices in the form of 'petrodollars' back into the US markets. We believe that a large portion of the dollars generated by energy price increases don't get repatriated in non-dollar forms. Instead they are plowed into US treasury markets. Although by the second year, we would have thought oil exporters would be looking to reallocate their money out of the US Treasury market and into higher yielding assets the relationship between energy prices and treasuries is still 'broken'.
One factor, which may have shifted the relationship in the 1970s, is the differing nature of the shocks. Under this assumption, the energy shock that lasted through the 1970s and early 1980s was different because it was a supply shock initiated by an oil embargo and price controls. This in conjunction with the fact that the treasury market was so much less global at the time may have prevented the reallocation of petrodollars back into US Treasuries and actually allowed interest rates to rise in line with energy prices. However without knowing the elasticity of demand, the relationship between energy prices and profits is difficult to know. Nevertheless the macroeconomic environment surrounding the current shock is different. This shock is a demand shock, and overall capital flows are much freer.
When we look at less numerical data, using simple linear price graphs rather than attempting to show a scatter plot and a statistically significant relationship, we note that energy price increases even in the 1970s tended to suppress real rates. The chart above looks at real oil prices and real 10yr yields (rather than nominal yields shown previously). The lags appear to vary, but the black arrows at the bottom of the chart point to three major energy price shocks that have each lead to the real yield curve inverting. We believe the current low yield/flat curve environment may be due to this phenomenon of excess petrodollars being recycled back into the treasury markets. When those funds are withdrawn we believe rates will begin to rise.
The red arrow at the top of the chart highlights a period when the exact opposite shock occurred—energy prices dropped precipitously and the real yield responded by spiking. We looked more closely at the same time frame in the chart below, which focuses on this one and a half year period, but highlights the strength of the relationship by showing real yield on an inverse axis. As energy prices dropped, energy rich nations were generating less free cash from their crude sales. Petrodollars were removed from the global economy. This decline in liquidity lead to an increase in interest rates, but as energy prices returned to their pre 2001 levels, the yield levels too returned.
This reaction by the markets is in contrast to the high energy prices/high yield relationship that an inflation focus generates. It supports our contention that since about 2001 the yield curve has not been trading inflation and can not be used as a guidepost for inflationary expectations. Whether it is fewer petrodollars, or simply markets focusing on the positive growth impact of lower energy prices, lower energy prices will lead to higher interest rates. A lasting break in crude could be what it takes to bring the curve out of inversion and rates back to normalcy. It may take a month or more for the impact of the current decline in energy prices to filter through to interest rates, and certainly the recent implosion of one or more large hedge funds may be adding some safe haven buying to the debt markets, but MGR believes it is one of the greatest risks to the market going forward.
One big question over the next two to three quarters, is how does the consumer react to a pullback in the housing market? Will the housing market continue to collapse, or will it stabilize at low levels? Will the slower home sales numbers pressure the consumer?
Unfortunately these questions are easier asked than answered. The chart below looks at the relationship between the headline retail sales number and housing starts. There definitely is a relationship, we can see the correlation between weaknesses in the late 1990s and perhaps even see a relationship between the slowdown in retail sales in 1994 and the housing market decline, but the strength of that relationship is not necessarily quantifiable. The housing market is clearly more volatile than the retail market, and there appear to be varying lags in the market's reaction to strength or weakness in the housing market. The chart below suggests we may start to see downward pressure on the consumer as a result of the housing market weakness, but this is not the driving factor—something else is going on to support consumption.
MGR believes part of that something else is the job market. Yes payroll counts have been disappointingly low, but the unemployment rate is also low and weekly claims are most definitely not rising. It isn't a problem of people losing jobs, but finding jobs. Even if we take into account previous data revisions to the BLS measurements, the 4.8% unemployment rate is a major driver or retail sales.
Although the relationship between retail sales and unemployment isn't strong, it is supported by a basic consumer logic—the more people who are working the more people feel free to shop. We can see this in the chart below, which looks at the relationship between disposable personal income and retail sales. Higher earnings lead to more disposable personal income—another index that relates closely to retail sales. Over the last twelve months, however the retail sales/disposable personal income relationship hasn't tracked well. But the current pullback in retail sales in conjunction with the sudden increase in personal income may lead to a re-coupling of these two numbers.
Overall MGR believes that job security and free cash are more responsible for strength in the retail markets than the less fungible housing markets. Although we have not included the graph in this presentation, we were somewhat surprised to see no relationship between retail sales and home prices (not starts). What we have been able to define is a relationship between retail sales and the MBA refinance index. This relationship supports the popular notion of home as piggy bank and suggests people are refinancing and pulling money out of their homes to spend on themselves, but the refinancing per say is not impacting home prices. The lags vary between 12 and 16 months depending on your time frame. The data suggests the stabilization in the refinance activity may actually lead to stabilization in the retail sales level, at a 6-7% rate.
Going forward, MGR would certainly keep a close eye on the housing market, but we would keep a closer eye on the job market. For a homeowner that is not planning on moving, a job and their free cash are more important to their consumption patterns. Going forward the risk is an indirect one. The main risk to consumption is not straight from housing to the consumer, but from housing to construction and mortgage refinance layoffs and from there to consumption. This path is far more difficult to track in government data.
The holiday shopping season will be a key driver of the fourth quarter growth rate. Although the season does not officially start until Black Friday, the first indication of the strength of November and December retail sales is generally thought to materialize with reports of Halloween sales. Pre-reports from the NRF and other market research groups expect to see this year's sales as good but not great. We would tend to agree with this outlook because we believe the phrase fits with the overall economic sentiment as well.
One of the factors that determines the strength of the holiday season is the elusive merchandising decisions made long before the season starts. This year high gas prices in the summer months, when orders were placed for holiday goods, may have led to conservative stocking. Although this will reduce total sales, it also may influence price reductions, allowing the total revenue to remain more or less stable. We have also seen indications that the average price level of items sold may increase as the signaling strength of high priced goods has not been hampered by the housing market and the consumer's willingness to pay on higher end products appears to be unfazed. High income shoppers remain focused on high price (and high margin) goods. Even at discounters, high priced toys have been selling fast early in the season. According to Wal-Mart's chief toy officer this is a dynamic that has not been seen in five years.
The pullback in gasoline prices will also certainly assist consumption patterns, but despite the near term decline, there is no guarantee that crude prices will remain at or below $60 into the holidays. We certainly saw the impact of lower gas prices in the strong September chain store sales reports, but families at the bottom end of the income distribution may still be working to make up any savings lost from the summer's high prices. This impact should be marginal as fear may be a more significant pressure on holiday retail sales. Although the housing market slowdown is at the forefront of every retailer's list of risks, the MBA refinance index to date suggests stabilization rather than moderation in housing related spending.
Strong employment dynamics will support retail sales through the holiday season. Job availability and personal disposable income are probably the two greatest supports to the consumer, and we don't expect to see any moderation in these two indexes in the medium term. There is a risk to the retail sales strength—holiday hiring, which can be a significant source of extra cash, is not likely to be strong this year. Retailers in general have been the slow spot in the employment market. As of the September employment report retailers have cut an average 11.5K jobs per month in 2006. Although some of this may be due to the introduction of technology into the checkout line (self service checking), much of it is likely an ongoing reflection of the cautious approach to hiring retailers are taking with respect to the housing market slowdown. At the margin the lack of hiring may negatively impact the holiday shopping season. But overall it is difficult to quantify the impact of preseason hiring. The one report we have seen suggests Wal-Mart has reported they plan to keep their hiring levels unchanged from last year.
The
major risks to the outlook presented above have remained relatively stable since
we last looked in July. They are primarily based on the market's reaction to
the two greatest risks facing the economy, housing and energy. Although we
believe these risks are mediated, they still create the potential for a
correction in growth. These risks are:
Will the housing slowdown impact job growth outside of the construction
industry and if so how will it spread into the consumer market?
How long will it take before consumers start reallocating money
temporarily allocated to gasoline back into discretionary items such as
clothing or food away from home? Will this shift in consumption support or suppress
retail behavior into the holiday shopping season?
We
tend to believe that consumers have refinanced most of their personal debt into
lower fixed rate mortgages, which has elevated disposable income levels. We
also believe the low unemployment rate will contribute to consumer security
about the future despite the housing market's slowdown. This should keep consumers
in a spending mood. The corporate fall-out of the housing market will impact
this expectation. If corporations retrench, we will have a bigger economic problem
which may actually lead to a recession in the first half of 2007. But MGR
believes this is not the primary outcome into the end of the year. Instead we
expect to see the consumer risk dissipate.
Sell EDZ7 at 95.18. Primary Target 94.81, secondary target 94.62, risk over 95.41.
MGR's relatively positive outlook presents the opportunity to sell Eurodollars in the nearby months. Even if the Fed decides to cut rates in 2007, we do not believe they will take a full 50bps off of the current level. We would look to sell the Dec Eurodollar above 95.18 with a primary target 94.81, secondary target 94.62.
Sell TYZ6 over 107-10. Primary Target
106-00, risk over 108-30
It will be a long hard trip lower, but MGR would look to sell the long end of the curve into the end of the year. We would keep a close eye on this position, as the note would prefer to rally through the fourth quarter, but MGR believes the market's three month trend higher is one step too far.
![]()
Scorecard
on 7/06 Seasonal Outlook Trade Recommendations:
Sell the 2/5/10 Butterfly at market (13.5bps) or better. Target 0bps, risk over 18 to
20bps.
Outcome:
4.5bps loss.
![]()
Disclaimer:
Trading commodity futures and options involves substantial risk of loss. The recommendations contained in this letter is of opinion only and does not guarantee any profits. These are risky markets and only risk capital should be used. Past performances are not necessarily indicative of future results. This is not a solicitation of any order to buy or sell, but a current futures market view provided by Cannon Trading Inc. Any statement of facts herein contained are derived from sources believed to be reliable, but are not guaranteed as to accuracy, nor they purport to be complete. No responsibility is assumed with respect to any such statement or with respect to any expression of opinion herein contained. Readers are urged to exercise their own judgment in trading!
Source: Moore Research Center, Inc.
| Date | Reports | Expiration & Notice Dates |
|---|---|---|
| 10/26 Thu |
7:30 AM CDT - Durable Orders(Sep)
7:30 AM CDT - USDA Weekly Export Sales 7:30 AM CDT - Initial Claims-Weekly 9:00 AM CDT - New Home Sales(Sep) 9:00 AM CDT - Help-Wanted Index(Sep) 9:30 AM CDT - EIA Gas Storage 3:30 PM CDT - Money Supply |
LT: Oct Feeder Cattle(CME)
Oct Feeder Cattle Options(CME) Nov Natural Gas Options(NYM) Nov Unleaded Gas Options(NYM) Nov Heating Oil Options(NYM) |
| 10/27 Fri |
7:30 AM CDT - GDP-Adv(Q3) 7:30 AM CDT - Chain Deflator-Adv(Q3) 8:50 AM CDT - Michigan Sentiment-Revised(Oct) 2:00 PM CDT - Dairy Products Prices |
LT: Oct Platinum(NYM)
Nov Natural Gas(NYM) Nov Corn Options(CBT) Nov Rough Rice Options(CBT) Nov Soybean Options(CBT) |
| 10/30 Mon |
7:30 AM CDT - Personal Income & Spending(Sep)
|
FN: Nov Soybeans(CBT)
Nov Rough Rice(CBT) Nov Natural Gas(NYM) |
| 10/31 Tue |
7:30 AM CDT - Employment Cost Index(Q3)
9:00 AM CDT - Chicago PMI(Oct) 9:00 AM CDT - Consumer Confidence(Oct) Agricultural Prices |
LT: Oct Live Cattle(CME)
Oct Fed Funds(CBT) Nov Heating Oil(NYM) Nov Unleaded Gas(NYM) Nov Lumber Options(CME) |
| 11/01 Wed |
9:00 AM CST - Construction Spending(Sep)
9:00 AM CST - ISM Index(Oct) 9:30 AM CST - API & DOE Energy Stats Auto & Truck Sales(Oct) |
FN: Nov Orange Juice(NYBOT)
|
| 11/02 Thu |
7:30 AM CST - USDA Weekly Export Sales
7:30 AM CST - Initial Claims-Weekly 9:30 AM CST - EIA Gas Storage 3:30 PM CST - Money Supply |
FN: Nov Heating Oil(NYM)
Nov Unleaded Gas(NYM) |
* Please note that the information contained in this letter is intended for clients, prospective clients, and audiences who have a basic understanding, familiarity, and interest in the futures markets.
** The material contained in this letter is of opinion only and does not guarantee any profits. These are risky markets and only risk capital should be used. Past performances are not necessarily indicative of future results.
*** This is not a solicitation of any order to buy or sell, but a current market view provided by Cannon Trading Inc. Any statement of facts herein contained are derived from sources believed to be reliable, but are not guaranteed as to accuracy, nor they purport to be complete. No responsibility is assumed with respect to any such statement or with respect to any expression of opinion herein contained. Readers are urged to exercise their own judgment in trading!