
In This Issue
Reports and Expiration Notices
October 19, 2005
Dear Fellow Futures Traders and Clients,
I want to address the situation at hand concerning REFCO, LLC (Futures Division). As it has been noted REFCO, LLC is one of the top clearing houses in the futures industry, while CEO Phillip R. Bennett of REFCO, INC. is under scrutiny for fraud, please recognize that REFCO, LLC (Futures Division) is a strong Commodity force and is functioning and honoring its’ commitments thus far.
For those of you who would like a better understanding of how this situation affects REFCO, LLC, I have provided a brief report from the CME (Chicago Mercantile Exchange) dated October 13, 2005. CME’s clearing member, REFCO, LLC, is a subsidiary of REFCO, INC., but it is a separate company with its own accounts, assets and customers. These accounts, assets and customers are protected through a comprehensive federal statutory and regulatory regime and other financial safeguards and risk management protections provided by the CME Clearing House. All customer funds are required to be segregated from firm assets, held in specially identified accounts and are not subject to creditors’ claims against the firm.
If you are a client, or currently trade through REFCO, LLC (Futures Division) and are concerned with the issues at hand, keep in mind that Cannon Trading clears through five different clearing houses (Futures Clearing Merchants). We, at Cannon Trading Company will be happy to discuss other online trading software, as well as commissions and any other questions you may have. Please inquire directly with your broker or click here.
I want to personally thank you for letting Cannon Trading Company be a part of your trading day.
Sincerely,
Mike Levy
President
by Marshall Steeves
Natural gas prices will continue to range trade as Gulf of Mexico production is slow to recover but lower-than-usual industrial demand keeps net injection into storage near the 5-year average. The very active hurricane season following summer heat waves have boosted prices to record levels that aren’t likely to be reversed in the forecast period. We look for an $11.00-$16.00 range.
Natural gas prices have surged to record-high prices against a backdrop of repeated hurricane damage to US Gulf Coast production infrastructure; record heat this summer spiking gas-fired power generation demand; rising oil prices negating the incentive to switch fuels amongst power generators and manufacturers that are capable of doing so; demand growth continuing to outpace supply growth; no new LNG regasification terminal developments, and the dim prospects of any coming online in the next 2-3 years; diminishing storage cushion throughout the summer on account of higher-than-average demand from electric utilities; residential demand growth continuing at explosive rates, with 90% of new single-family homes built with gas heat in a red- hot US housing market this year; the rotary rig count pushing to record high but not adding significantly to production due to dry holes and disappointing reservoirs. The National Weather Service winter outlook is indecisive but others forecast a cold winter in the consuming region. We expect gas to trade a wide $11.00-$16.00 range with potential spikes due to any further supply shocks such as storms in the Gulf of Mexico, or a demand shock in the form of a colder- than-normal winter. We recommend selling June gas at the market, expecting 35-cents and risking 13-cents from the point of entry. We would sell three $16.00 Nov gas calls, expecting premium and risking $16.00 close. We would also sell two $11.50 Nov gas puts, expecting premium and risking $11.50 close.
Demand
Nat gas demand is projected to fall 1.2% in 2005 with industrial use down nearly 8%. The forecast is premised on a “base case” scenario that assumes moderate economic growth. Demand is seen recovering 3.0% in 2006 on an assumption of normal weather returning and industrial demand resuming normal levels. Residential demand is projected to decline slightly this year while commercial and industrial demand are projected to either hold steady or slip due to fuel switching. Electric generation demand is seen up in concert with the increase in power sector growth.
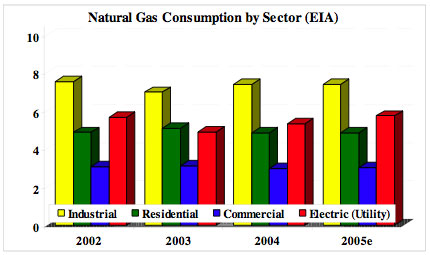
Residential demand is seen at 4.87-bcf, just a hair under 4.88-bcf in 2004. The weak winter demand in Q1 accounts for much of the lack of growth here because new single-family home development continues to rely disproportionately on gas for heating. Moreover home sizes have increased and of course 2005 was a banner year for housing. Modest growth is expected in 2006, to 5.00-tcf, as the housing market cools off a little.
Commercial demand is seen rising slightly to 3.06-tcf this year from 2.98-tcf last year, though this may be overoptimistic in light of demand destruction following the hurricanes in the Gulf. Demand is projected to remain flat in 2006 at 3.04-tcf.
Industrial demand is seen bearing the brunt of the post-storm demand destruction, with a decline of almost 8% to 7.87-tcf this year from 8.51-tcf in 2004. Industrial users are particularly sensitive to price rises and react accordingly. But a strong rebound of around 6% is projected in 2006 to 8.34-tcf assuming recovery in the Gulf region.
Electric power demand is seen rising to 5.66-tcf this year from 5.35-tcf in 2004 as electricity demand continues to expand. The unusually hot summer peaked power usage amidst high cooling demand. In 2006, power demand is projected to rise to 5.74-tcf off continued power plant expansion.
Supply
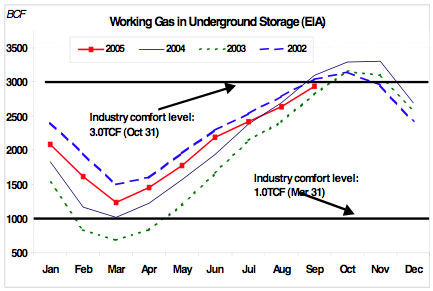
Supply is seen rising this year though dry gas production is barely higher as imports including LNG are becoming more part of the mix. Weekly EIA storage data show working gas in underground storage at 2.929-tcf as of September 30, below year-ago levels but above the 5-year average. The storage deficit to the year-ago level has swelled to 151- bcf and the surplus over the 5-year average has compacted to 40-bcf. The 5-year average injection over the last five weeks in the season is 217-bcf, which would take inventories to 3.146-tcf by early November. The surplus in working gas in storage has eroded due to hot weather in the consuming region and Gulf of Mexico production shut-ins during June and July, and now in September with Hurricanes Katrina and Rita. The latter trend seems likely to persist through October, leaving end-of-season stocks above the 3.0-tcf minimum comfort level but probably not at a record high. Nat gas production is projected by EIA to decline 3% this year because of the hurricanes, but rise 4.2% in 2006. US net imports of gas are projected to rise 0.1% in 2005 and 10.4% in 2006. LNG imports are seen off slightly in 2005 at 0.71-tcf. The American Gas Association says US Nat gas supplies are adequate to meet this winter’s demand with underground storage on track to reach 3.2-tcf by Nov 15. Between 1-3-bcfd of gas production in the Gulf could be shutdown through Mar 2006. Average retail gas bills will be up 30-40% from a year ago as opposed to the EIA estimate of a 50-70% increase.
Major US gas reserves remain unavailable due to legal restrictions. With drilling bans in place off the coasts of California and Florida on top of limited access to the Rockies Basin, there are limits to where new gas supplies can come from. Less than half the gas in the eastern Gulf of Mexico is accessible while 60% of the Rockies gas is drillable and the gas off the East and West Coasts is entirely off limits. The Congress was attempting to address this issue in a follow-up energy bill, however the measure was expected to be filibustered in the Senate.
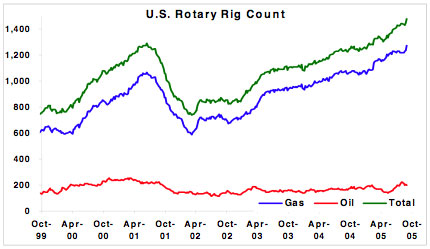
The Baker Hughes weekly rig count stood at 1,481 as of October 7thand the Nat gas rig count stood at 1,264, an all-time high. However despite this historically high rate, many dry holes have been drilled and less attractive reservoirs have been tapped into. So the predictive value of the rig count has diminished given the flattening out of production growth in recent years. So despite steady gains in drilling activity, the fact that much offshore and onshore drilling isn’t permitted in the Rockies or along the East and West Coasts limits potential sources of new supply.
Weather
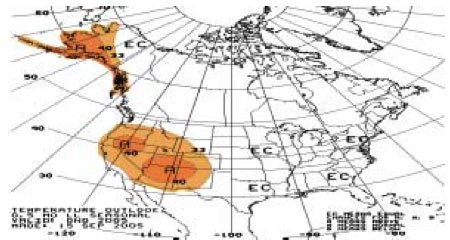
The National Weather Service 60-day outlook calls for above-normal conditions in the West and mostly seasonal elsewhere. This forecast is neutral in the Midwest/East Coast consuming region though the Southwest and Plains are seen averaging above normal. However this is not to say that the high-consumption areas won’t average above normal, just that the models aren’t definitive. Private forecasters are divided on the winter outlook, with some pointing to analog years that had hot summers followed by cold winters. But the jury is still out on this issue. EarthSat’s Oct- Nov outlook calls for warmer eastern temperatures to turn colder in November with the opposite true in the West: cooler conditions in October being followed by above average temperatures in November. This year has already become the second most active hurricane season on record and could tie the record 21 named storms of 1933 with one more. Even if the numerical record isn’t surpassed, certainly the devastation from Katrina and Rita has already created a record level of supply disruption.
Outlook
The outlook leans bearish absent any new storm threats in the Gulf of Mexico, though we won’t be out of the woods until the end of November. Then the concern will be winter heating demand, and the gas market will be driven by changes in temperature through November and December. Ending storage levels are likely to be adequate, around 3.1-tcf, but just barely so. In any event residential gas prices will be substantially higher than a year ago and cause hardships. The Henry Hub spot price is projected to average $9.00 in 2005 and $8.70 in 2006. DOE predicts it is likely to remain above $12 until peak winter demand ends. We foresee an $11.00- $16.00 range through the forecast period, depending on the pace of injections through the remainder of October and on the trend in winter weather at the outset of the season.
Disclaimer: There is a risk of financial loss in futures and options trading. Futures trading is neither easy nor an easy way to make money. It takes hard work to have success. Please use sound money management when trading futures. Past performance is not necessarily indicative of future results. Nothing in this newsletter is intended to be a trading recommendation for you to buy or sell futures or options. All information has been obtained from sources believed to be reliable, but accuracy is not guaranteed. Readers are solely responsible for how they use the information in this newsletter.
| Date | Reports | Expiration & Notice Dates |
|---|---|---|
| 10/20 Thu |
7:30 AM CDT - USDA Weekly Export Sales
7:30 AM CDT - Initial Claims-Weekly 9:00 AM CDT - Leading Indicators(Sep) 11:00 AM CDT - Philadelphia Fed(Oct) 3:30 PM CDT - Money Supply |
LT: Nov Crude Oil(NYMEX)
Nov Feeder Cattle Options(CME) |
| 10/21 Fri |
|
LT: Oct Single Stock Futures
Oct Value-Line Options(KCBT) Oct DJIA Options(CBT) Oct Nasdaq Options(CME) Oct S&P 500 Options(CME) Oct Emini S&P 500 Options(CME) Oct Nikkei 225 Options(CME) Nov Orange Juice Options(CME) Nov Corn Options(CBT) Nov Oat Options(CBT) Nov Rough Rice Options(CBT) Nov Soybean Options(CBT) Nov Soybean Meal Options(CBT) Nov Soybean Oil Options(CBT) Nov US T-Bonds Options(CBT) Nov US T-Notes Options(CBT) Nov 10 & 5 Year T-Note Options(CBT) Nov Wheat Options(CBT) |
| 10/24 Mon |
|
|
| 10/25 Tue |
9:00 AM CDT - Existing Home Sales(Sep)
9:00 AM CDT - Consumer Confidence(Oct) Cotton Ginnings |
|
| 10/26 Wed |
9:30 AM CDT - API & DOE Energy Stats
|
LT: Oct Platinum(NYM)
Nov Unleaded Gas Options(NYM) Nov Heating Oil Options(NYM) Nov Natural Gas Options(NYM) |
| 10/27 Thu |
7:30 AM CDT - Durable Orders(Sep)
7:30 AM CDT - USDA Weekly Export Sales 7:30 AM CDT - Initial Claims-Weekly 9:00 AM CDT - New Home Sales(Sep) 9:00 AM CDT - Help-Wanted Index(Sep) 2:00 PM CDT - Consumer Credit(Jul) 3:30 PM CDT - Money Supply |
LT: Oct Feeder Cattle(CME)
Oct Gold(CMX) Oct Copper(CMX) Oct Mini-Silver(CBT) Oct Mini-Gold(CBT) Nov Natural Gas(NYM) |
Source: MRCI
* Please note that the information contained in this letter is intended for clients, prospective clients, and audiences who have a basic understanding, familiarity, and interest in the futures markets.
** The material contained in this letter is of opinion only and does not guarantee any profits. These are risky markets and only risk capital should be used. Past performances are not necessarily indicative of future results.
*** This is not a solicitation of any order to buy or sell, but a current market view provided by Cannon Trading Inc. Any statement of facts herein contained are derived from sources believed to be reliable, but are not guaranteed as to accuracy, nor they purport to be complete. No responsibility is assumed with respect to any such statement or with respect to any expression of opinion herein contained. Readers are urged to exercise their own judgment in trading!